Centre for Riverfly Conservation
Monitoring water quality – invertebrate benchmarks
Water quality is fundamental to the health of a river and the standard method to measure this is by monitoring the freshwater invertebrates present at each site. This requires a full invertebrate survey and whilst this is normally the responsibility of the Environment Agency, Government funding over recent years has been cut back to such an extent that we now have serious concerns that this function will continue.
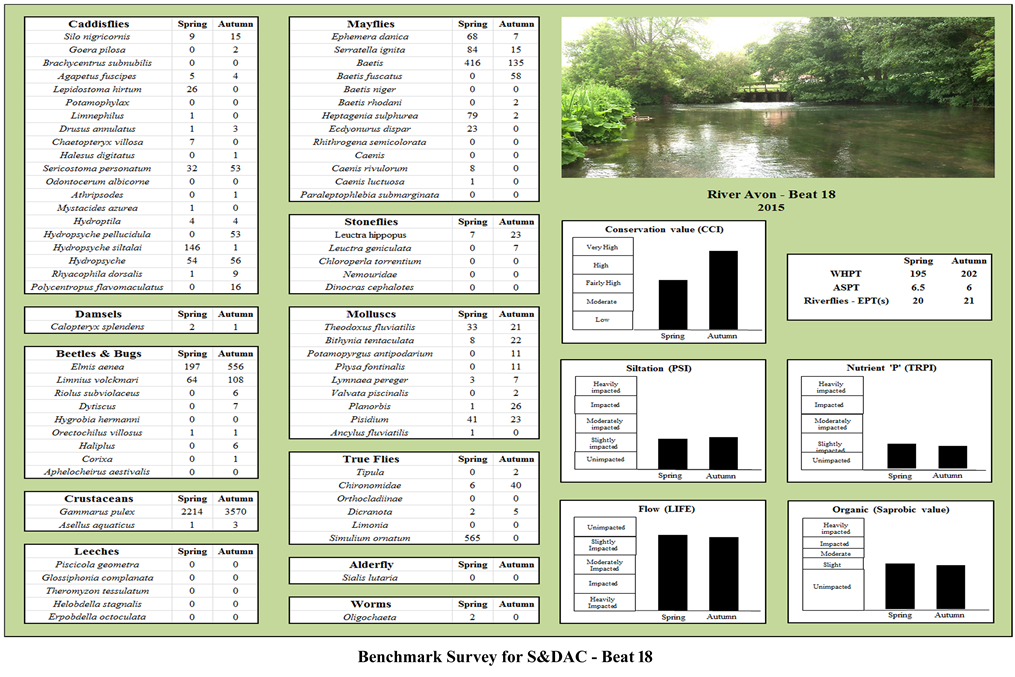
The Angler’s Riverfly Monitoring Initiative (ARMI) is essential to give us an early warning of a serious pollution incident, but in some cases this can divert us away from the underlying (and often increasing) problems we are seeing with the water quality of our rivers. Benchmark (fingerprint) surveys can now give us an accurate record of water quality by firstly recording the numbers of species present at each site; these are then fed through biometric software to calculate siltation & phosphates levels, organic pollution, flow rates and a conservation value. All of this is displayed on a single page.
| Stress Level Descriptor | PSI (sediment value) |
TRP (nutrient TRP value) |
Organic (saprobic value) |
Flow (Life) |
|---|---|---|---|---|
| E Heavily Impacted | 0 – 20 | 0 – 20 | 3.2 – 4 | Below 6 |
| D Impacted | 21 – 40 | 21 – 40 | 2.7 – 3.19 | 6 – 6.49 |
| C Moderately Impacted | 41 – 60 | 41 – 60 | 2.3 – 2.69 | 6.5 – 6.99 |
| B Slightly Impacted | 61 – 80 | 61 – 80 | 1.81 – 2.29 | 7.0 – 7.99 |
| A Clean | 81 – 100 | 81 – 100 | 1.0 – 1.80 | Above 8 |
Flow (LIFE- Lotic-invertebrate Index for Flow Evaluation) Lotic organisms are ones inhabiting or situated in rapidly moving fresh water.
The proportion of flow sensitive invertebrates in a sample describes the prevailing flow conditions at that site.
By assigning these organisms (macroinvertebrates) to one of six flow groups ( 1 = fast water through to 6 = no flow ) with their perceived ecological association with different flow conditions, plus counting how many there are, and finally calculating the average, we can evaluate how fast water is moving.
Siltation (PSI- Proportion of Sediment-sensitive Invertebrates ) PSI values are used to assess the presence of fine sediment. By calculating the percentage of sediment sensitive invertebrates (by species) in a sample, we can calculate how much silt is present. If there is a 20% proportion of sediment sensitive invertebrates in a sample, this equates to 80% silt. Silt suffocates the river bed, prevents aquatic egg development, traps pollutants, stifles life.
Nutrient Pollution (TRPI – Total Reactive Phosphorous Index) + River Type By counting the number of phosphorous tolerant and intolerant macroinvertebrates in a sample plus associating the river type (numerical figure equivalent shown in TRPI measurement category e.g.1à 4 ) and season with the number of invertebrates found, a nutrient value can be established. Soil erosion is a major contributor of phosphorus to streams. Phosphorus tends to attach to soil particles and can, under the right conditions, set off a whole chain of undesirable events in a stream including accelerated plant growth, low dissolved oxygen, and the death of certain fish, invertebrates, and other aquatic animals.
Organic ( Saprobic Value) The degree to which the decomposition of organic material is occurring in an aquatic environment. Every invertebrate species has a specific tolerance level equating to the amount of oxygen, organic matter, products of septic decay, and products of mineralization that they live in. By identifying which invertebrates inhabit an environment, a quantitative measure of organic decay can be obtained. e.g. 1.0 à 1.8 = large variety of species and high bioactivity, 3.2à4.0 heavy pollution with sewage or other organic materials, mass development of bacteria that are involved in decomposition processes, a high rate of oxygen consumption, and a high production of ammonia and hydrogen sulfide.
Invertebrates as Indicators
EPT/Riverflies ( Ephemeroptera/Plecoptera/Trichoptera – Mayfly/Stonefly/Caddisfly) The total count of each species for each of the three Riverfly families. Upper Chalk Streams should have a figure >21. A loss of 5 species equates to an increase in sediment by 1 measurement category e.g. A count going from 25 to 20 would mean an increase in sediment from un-impacted to slightly impacted.
Conservation Value Index (CCI) Provides an indication of exceptionally rich or regionally unusual invertebrate populations by scoring the invertebrates found based on their rarity. The rarer the invertebrate, the higher the conservation value.
BMWP ( Biological Monitoring Working Party) Family by Organic Pollution Sensitivity. Less sensitive measure than Saprobic. It is now superseded by WHPT. Families of invertebrates are rated, 1-10 according to their pollution sensitivity ( 10 = very sensitive 1= not very sensitive) Species of different Families with a the same pollution sensitivity are grouped together.These values are then totalled. The higher the value the less polluted the water.
WHPT ( Walley Hawkes Paisley Trigg ) Family by Abundance and Organic Pollution Sensitivity The same as BMWP above but takes into account how many of each family. The higher the value the less polluted the water.
ASPT Average Score Per *Taxon ( Family ) The averaged BMWP/WHPT Family score
This figure indicates the type of environment the invertebrates live in. The bigger the value, the less organically polluted the water. Range 4 polluted à 7 not polluted. Expect >6.3 for Upper Chalk Streams.
*Taxon = Family e.g. Ephemeridae ( Mayfly ) 3 species in the Family, danica, lineata and vulgata.
Benchmark surveys have been completed for most of our sites on the Avon, Wylye & Ebble and further surveys will be completed next year on the Nadder and Bourne. This gives us a record that can be referred to in case of problems and has already provided essential data to enable us to deal with two serious problems on Beat 22 at Durnford and the Longbridge fishery on the river Ebble.
To aid identification, high quality digital images of each species have been produced and, with funding from both S&DAC and S&TC UK, these are being developed into a downloadable App. These show easily identifiable features for each species, plus its pollution fingerprint and conservation value; this App is available now with all proceeds going to the conservation of our rivers.
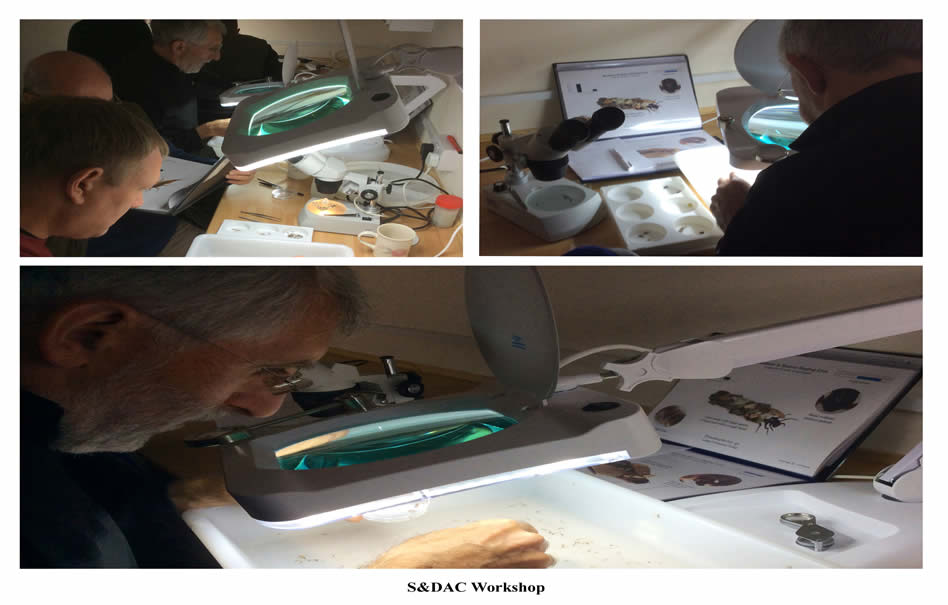
With the ever increasing pressures on our rivers, benchmark surveys are becoming essential if we are to even stand a chance at protecting them; commercial benchmark surveys are being carried out throughout the country but these are costly. The S&DAC initiative enables benchmark surveys to be carried out by individual clubs and a highly successful training course has been carried out at the Cart Shed; further courses are planned for 2016.


